Leaving Community
Are you sure you want to leave this community? Leaving the community will revoke any permissions you have been granted in this community.
Hypothesis Center
 Signaling Pathways Project (SPP) Tutorial
Introduction:
The Signaling Pathways Project (SPP) is a FAIR data environment for hypothesis generation using public transcriptomic and ChIP-Seq datasets. It incorporates a powerful meta-analysis platform that surveys across millions of biocurated 'omics data points to make high-confidence connections between signaling pathways and their transcriptional targets. The site accommodates both standalone “idea-only” hypothesis generation as well as custom gene list upload.
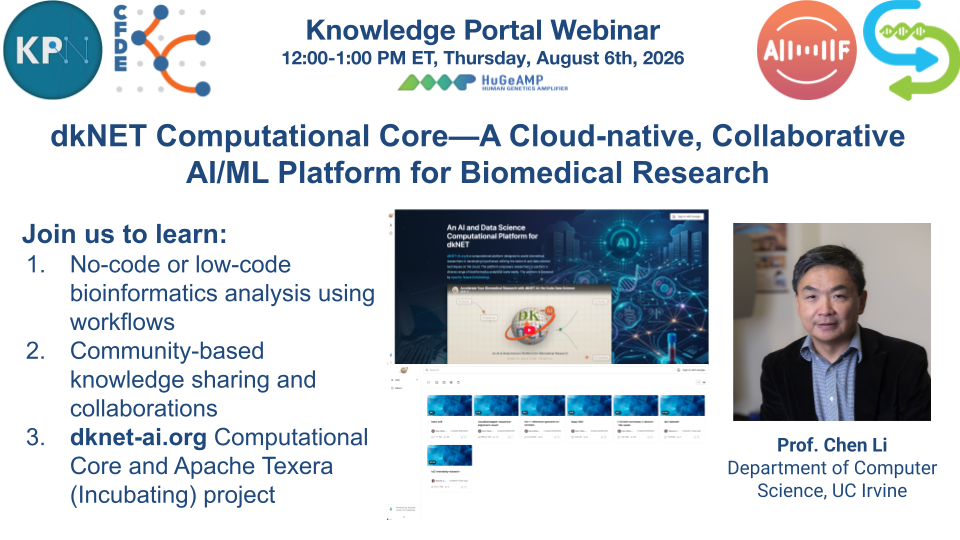
dkNET Webinar: The Signaling Pathways Project, An Integrated ‘Omics Knowledgebase
In this webinar, attendees will learn how to use biocuration and consensomic analysis of 'omics data to model mammalian cellular signaling events in organs and intersections between cellular signaling pathways and disease, and identify node-gene target regulatory relationships previously uncharacterized in the research literature. The webinar was presented by Drs. Scott Ochsner and Neil Mckenna
Tutorial That Has Been Selected For You:
|
What hypothesis are you developing or what information are you looking for? Evidence for target genes of my signaling node of interest |
The hypothesis generation examples that you selected: Transcriptomic evidence for human genes that are most transcriptionally responsive to insulin receptor signaling |
Learning Goals:
Identify genes that are regulated by a specific signaling pathway using SPP Ominer
-
Learn how to do SPP queries based on the hypothesis that you are developing or the evidence that you are looking for, including:
Searches SPP for data points from transcriptomic (expression array or RNA-Seq) or cistromic datasets
Filters the results
Returns the results in the form of an SPP Regulation Report
Learn how to view results
Tutorial Lesson:
STEP 1: First let’s open a new window with the Signaling Pathways Project
To make it easier to walk through the tutorial, please launch a new window
STEP 2: Go to Ominer.
Ominer is the Signaling Pathways Project (SPP) query interface. Four types of target gene queries are currently available in SPP Ominer. All queries can be submitted as either transcriptomic or cistromic queries.
Single Gene Single gene queries are designed for researchers who wish to evaluate transcriptomic or cistromic evidence for regulation of a single target gene of interest across all nodes, or within specific categories, classes or families.
Gene Ontology (GO) term GO uses evidence from the research literature to link genes to specific cellular biological processes and functions. In doing so, GO enables biologists to go beyond single target genes to generate hypotheses using familiar biological terms that encompass numerous independent genes. Ominer identifies evidence for transcriptional regulation of GO term genes by members of a specified class of pathway node.
Consensome SPP maintains rankings for genes based on the inferred computed strength of their regulatory relationship with a given signaling node or node family. These rankings are referred to as “consensomes”.
Custom gene list A user can submit a custom list of up to 500 approved gene symbols or Entrez GeneIDs. Ominer will return evidence for their transcriptional regulation of GO term genes by members of a specified class of pathway node.
Learn more about SPP Ominer target gene queries in the introductory article in Scientific Data.

STEP 3: The first thing one needs to do within the SPP Ominer is to tell how SPP Ominer selects your ‘Target gene(s) of interest’ from the drop-down list. In this tutorial we will be selecting Consensome.
Consensomes are a list of genes ranked according to a meta-analysis of their differential expression in publicly archived transcriptomic datasets involving perturbations of a specific signaling pathway in a given biosample category. Consensome are intended as a guide to identifying those genes most consistently impacted by a given pathway in a given tissue context.
Target gene(s) of interest
STEP 4: Next, you will need to select an ‘Omics Category based on your interest (default is transcriptomic). The Omics Category can be transcriptomics (expression array or RNA-Seq) or cistromics (ChIP-Seq) data. For this tutorial, please select Transcriptomics.
The transcriptional functions of signaling pathway nodes are studied using one of two types of methodology:
Transcriptomic datasets report on direct or indirect effects of nodes on gene expression using, e.g. expression arrays or high throughput sequencing-based approaches such as RNA-Seq or scRNA-Seq. They can be used to study all nodes but are typically used to study transcriptional biology of membrane bound receptors, transporters, ion channels and cytoplasmic enzymes & nodes.
Cistromic datasets report on node regulation of gene expression through direct protein-DNA interactions, sometimes referred to as trans) using, e.g. ChIP-Seq. They are typically used to study transcription factors, epigenetic regulatory enzymes, nuclear receptors & other DNA/chromatin-binding nodes.
Learn more about SPP biocuration of transcriptomic and cistromic datasets in the introductory article in Scientific Data
Omics Category
STEP 5: Next, we will configure the Signaling Pathways Module Family.
SPP combines existing, well-established vocabularies and terminologies into a single classification of signaling pathway nodes based around four top-level categories:
Receptors Based on the International Union of Pharmacology (IUPHAR) Guide To Pharmacology classification (website | citation)
Enzymes Based on the International Union Of Biochemistry And Molecular Biology (IUBMB) Nomenclature Committee classification (website | citation)
Transcription Factors Based on the TFClass terminology (website | citation)
Co-nodes Based on SPP’s own annotations and those of the Human Genome Organization Gene Nomenclature Committee (HGNC) (website | citation)
Learn more about SPP signaling node classification in the introductory article in Scientific Data.
You must select a Category, Class, and Family to view a consensome.
In this tutorial, we will be selecting Receptors, Catalytic receptors, and Insulin receptor family.
Signaling Pathway Module Category
STEP 6: You will select a Biosample Category including Species, Physiological System and/or Organ of interest.
If sufficient curated datasets are available, SPP calculates conensomes for specific Physiological Systems or Organs. If not, only an “All Physiological Systems” consensome will be available.
In this tutorial, we will be selecting Human and All Physiological Systems.
Biosample Category
STEP 7: Now you can submit your query by clicking the "Submit" button.
STEP 8: Interpreting the results?
Transcriptomic consensomes are displayed in ascending order of consensome p-value, which is the probability that the observed frequency of differential expression occurred by chance. Gene target names link to a transcriptomic Regulation Report for that target showing the data points underlying the consensome. For either consensome type, the top 10% of targets are displayed in the browser. The full conensome can be downloaded by clicking "Download Results".
Cistromic consensomes are displayed in descending order of MACS2(Model-based Analysis of ChIP-Seq) peak value for all nodes in a given target family. Gene target names link to a cistromic/ChIP-Seq Regulation Report for that target showing the data points underlying the consensome.
TRANSCRIPTOMIC REPORTS The horizontal axis is the transcript relative abundance (fold change). The vertical axis indicates the Category, Class and Family of the manipulated node. The bottom level labels indicate any genetic (in italics, e.g. overexpression, knockdown) or pharmacological (in bold, e.g. BSM administration) node manipulations.
An example of transcriptomic reports
Data points in Regulation Reports are fully interactive. Click on any data point to see its details, and to navigate to a page describing the experiment, as well as a link to the full dataset page.
Reference
Section 1. SPP UI walk-through:1B- 1E, p5-11 in the supplement:
https://static-content.springer.com/esm/art%3A10.1038%2Fs41597-019-0193-4/MediaObjects/41597_2019_193_MOESM1_ESM.pdf
About
The NIDDK Information Network (dkNET) serves the needs of basic and clinical investigators by providing seamless access to large pools of data and research resources relevant to the mission of The National Institute of Diabetes Digestive and Kidney Diseases (NIDDK). dkNET is hosted at University of California San Diego, and is supported by NIH NIDDK grant U24DK097771.
Recent News Entries

Contact Us
Email: info_at_ dknet.org